Algebra 2

Sunday, September 16, 2018

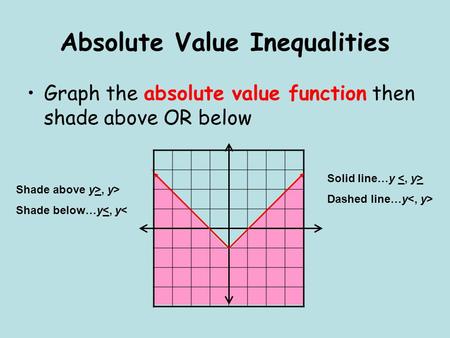
Lesson 2-6: Graphing Two-Variable Absolute Value Inequalities

Image result for graphing two variable absolute value inequalities
Watch Me 
Watch Videos 1-4. If the Video's cut off, please sign up for a free 30 day trial to continue watching the videos. These are great examples of what we did and learned in Class. 

Practice Worksheet 
Click Me
Answer to Worksheet 
Click Me
Posted by Unknown at 1:14 PM
Email ThisBlogThis!Share to XShare to FacebookShare to Pinterest

No comments:

Post a Comment

Newer Post Older Post Home
Subscribe to: Post Comments (Atom)

About Me

Unknown
View my complete profile

Blog Archive

  • ▼  2018 (32)
    • ►  November (6)
    • ▼  September (16)
      • Lesson 2-11: Writing Absolute Value Inequalities
      • Lesson 2-10: Solving Absolute Value Inequalities
      • Lesson 2-9: Solving Compound Linear Inequalities
      • Lesson 2-8: Writing Absolute Value Equations
      • Lesson 2-7: Solving Absolute Value Equations
      • Lesson 2-6: Graphing Two-Variable Absolute Value I...
      • Lesson 2-5: Modeling with Absolute Value Function
      • Lesson 2-4: Graphing Transformations of Absolute V...
      • Lesson 2-3: Identifying Transformations of Absolut...
      • Lesson 2-2: Attributes of Absolute Value Functions
      • Lesson 2-1 Learning the Absolute Value Function
      • Lesson 1-10 : One-to-One Functions
      • Lesson 1-9 Inverse Practice
      • Lesson 1-9: Inverses of Relations & Function
      • Graphing the Y-Intercept
      • Solving Two-Step Equations
    • ►  August (10)
Picture Window theme. Powered by Blogger.